How to Discover User Pathways across tech-products
The topic above is one of the most popular google search requests in tech-products building communities across the Globe. And, from my point of view, is one of the underestimated analytics approaches.
The reason is simple. Product managers want to know the user journeys across the frontend and how backend microservices contribute to that behavior – this is a key to UX. Software engineers want to automate IT Ops to know where product performance faults and find backend processes outliers, like growing service leaves/reinstalls, or calls to support line before mass scaling on the clients’ side. Marketers want effectively spend acquisition budgets, and want to know where the product processes drain in terms of conversions, content relevancy, or user cohort engagement. Product and data teams spend dozens of hours weekly to manually find the insights above.
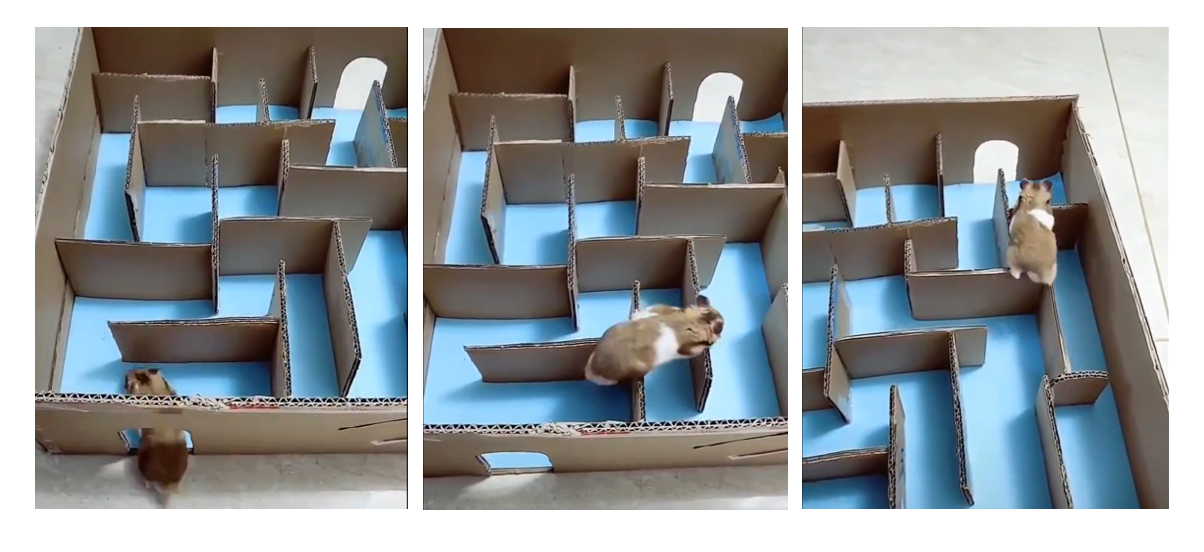
Looks like the hamster avoid the planned journey and build the personal one
Product teams are fragmented in the roles: of engineers, managers, and analysts. And everyone is relying on niche functional solutions as simple to launch and to use. In practice, every tech-product team meets the issue of real user behavior analysis across points of contact. And the reason is Customer Journey operations are cross-functional and link together frontend (web, app interfaces), backend (microservices and data sources), and 3rd party links like CRM-system, customer support operations (onboarding, call center, delivery in eCommerce, etc.). To obtain a view of users’ points of contact with a product, you need a holistic or general view of how your customers use your product. Nor dashboards with a spreadsheet of conversions, as well as a cohort analysis in terms of traffic relevancy would not help to find that. I mean the real user traces with insightful interaction details across every point of contact with process metrics per event.
Tech-driven products meet the same issue of operations management as the brick-and-mortar business has met 50 years ago. Tech products become more complex in both user feature consumption and microservices. More users mean growing the knowledge gap about how users journey across your product, and consequently how effectively your product works. You can not just come to microservice to ask about his influence on user experience. The only event-driven analytic tools are capable to manage IT-ops automation for such analysis.
Sadly to say, the current product propositions are quite fragmented and focused on resolving a very thin part of the task of every underlined group of experts.
The fragmented set of popular analytic tools and why they are not enough to go beyond known metrics.
- Product managers rely on funnel analysis, and use the web and mobile analytics tools such as Google Analytics, Amplitude, Mixpanel, and Heap to measure the statistics per known events. Those are the perfect tools for taking a detailed view of product metrics. But how do you manage user operations behind web-/application interfaces? How do you find insights, if you measure only the known part of a product? That set of tools would calculate the conversion metrics per event but are not able to show you the issues the customer met in detailed interaction and the place of precise point amid other events. How do you obtain the real user journey with all ineffectiveness till the continuation?
Obviously, a product manager, trying to go deeper for insight, is looking at the sequence of user acts step by step, trying manually to find triggers and differences in behavior. Juniors and Middle managers spend 40-50% of their time on manual behavior analytics or … just do not do it. Senior product roles do not involve user analysis.
As an outcome, a product team stays not data-driven, but human-driven. These decisions are done by expertise, not data insights. That is definitely fine for small products and teams, but absolutely non-appropriate for mid-sized teams and broader.
The bright example of avoiding pathways analysis – we do not need that kind of analytics. “What new I would know about my simple process? We have 10 microservices and insights can not be obtained.”
Funny fact, even in the simple sales funnel, which consists of 6-8 steps, up to 40% of user flow several times pass through every point of the sales funnel. The process owners surprised about 40-50% of the funnel several times pass through the A and B stages due to mistakes in the order form on the fulfillment stage, and the same issue meets due to broken data on the client-side. That simple insight can reduce time passed through the funnel up to 3x times by fixing that repetitive actions.
- Software engineers. Use monitoring systems such as DataDog, and New Relic to build dashboards about their IT-systems conditions and orchestration. That systems present data in dashboards and monitoring indicators help to identify issues in microservice conditions, in-house or suppliers. And if a software development team meat a product performance issue or code fault, they need to trace it-logs, read literally by eyes to understand the reasons, and locate the fault points. IT operations automation is the key point to saving Software team performance from a long-term perspective. Tools for engineers are not able to automate tracing. The development team still spends dozens of hours per release to find fault points per tech issue met.
- Marketers and startup growth teams. That is the most dependable role in terms of acquisition budget expenses vs outcome. If the content is not relevant to the target audience, the marketer takes time to get feedback – losing the capability to act quickly. You just grow costs for experiments and waste time to the go-to-market. We all do understand that button coloring or navigation replacement is not enough to grow the product significantly. Marketers should go deeper into the root-cause analysis of user behavior. User journey mapping is the only way to get into a customer’s shoes, not a manager’s. Try to analyze user pathways to generate hypotheses and you will boost your product growth. Traditionally marketers use UX research or manually read logs of a particular user journey to map it. Both take up to 50% of work time yearly. Maybe it is time to get an automated solution for user behavior mapping?
It is common for product managers to go to data-analyst and software engineers to find the reason for tech issues, triggers of behavior, or just to receive general data regarding the product to research where to go deeper and what the growth opportunity to research. All that repeat on a weekly basis and consume dozens of working hours of product- as well as data teams. And this is just the prior step to verifying the hypothesis and building the product growth plan. Also, a team should research the opportunity and usually review the user stories in manual mode, going on the user level.
Stop dig insights manually. Let’s automate user traces analytics.
All data about product growth issues like conversion loss points and triggers, bottlenecks with the underlying factors as microservices or pure performance of the support department. That means the dozens of hours may be focused on product growth, not the data mining and manual data tracing.
Every niche instrument provides a general picture but does not allow to avoid manual operations linked with user behavior research.
To respond to this query, the existing opportunities needed to be defined. There are a bunch of segmented solutions for every step to resolving a particular task.
What if I say, there is a way to estimate a user engagement without days of data cooking? The simple tool to automate that analysis and make it real-time and simple to use by any expert, involved in tech-product building.
Bringing together tech-product operations in one holistic tool to empower remote product teams to work together on tech-product efficiency.
The only way to automate user traces is the user event-driven graph-based analytics as Insightarc Analytics does. This approach means analytics based on planar graphs – when massive of data (IT logs) are generalized and presented as a set of coordinates linked by graph arrows. Every arrow is a visualized pass of every user action between two points of action. For example, eCommerce operations login, product feed, a basket, and payment ops are linked with multiple paths.
Some people say that it could be built by a data-science team. And how many product teams have data-science expertise keeping in mind that only 20% are data-driven? I’d say less than 2% across the Globe. That 2% are the most tech advanced and data-driven Companies, reach enough to make heuristic researches of algorithms.
And what to do with the other 96% of teams? To use SaaS to make their tech-product operations effective.
There are some approaches to automate user traces mapping.
Open-source process mining engines. That approach required highly skilled data engineers and data scientists in the house to deploy and manage infrastructure and ETL layers. As an open-source product, it should be fitted under the company data-processes specifics. That means a lot of Python coding. Also, you would need to link together the core with visual graph notation. Build a data bridge between your logs query and the analytical engine. That is the full-time job of the team of data-science professionals to roll out and orchestrate it. As an outcome, you receive a very limited functional taking real hours to analyze a limited data flow. Also as a downside – a static visual representation without the metrics above. That means you need to spend a dozen hours linking planar graphs with excel metrics.
Traditional process mining tools such as Celonis or Process Gold which are used to mine processes before robotic process automation or optimize corporate processes.
They are required to be deployed as an on-premise solution, to work highly load events data. That approach is costly and needs to be consulting supported to integrate and launch on-site. The perfect choice for enterprise with defined process efficiency teams. But non-enterprise IT- and product- or data teams are not able to use them due to pricing and technological complexity to regular usage.
- SaaS as Insightarc has a solution that is appropriate for user traces mapping and behavioral analysis automation. Insightarc makes 30-40 hours of data-science expert job in 15 minutes automatically via our user behavior analytics as a service. And the platform is equally appropriate for tech engineers as product growth experts as uses the same data sources for both. The platform can work with an open user-events structure, which means you should not cut the number of events or prepare to trace it. Just deliver the dataset to the Insightarc Core, and get the user traces automatically mapped with real-time pre-analytics done. Do not spend time on data and process mining. Avoid infrastructure building and orchestration. The actual simple tool for the insights mining for data and tech teams' daily operations.
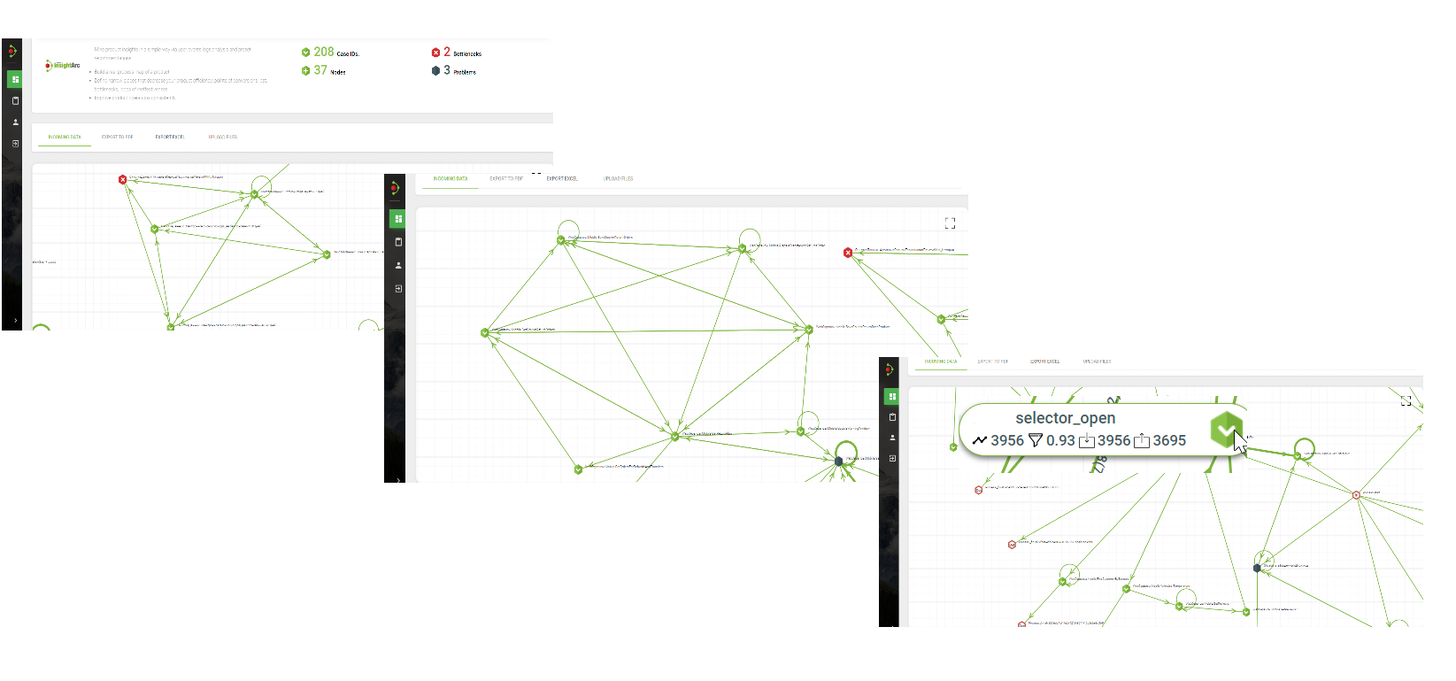
Example of fully automated mapping and process analysis of user traces across eCommerce
Changes velocity is key to tech-product growth: automate, know the root cause, and focus on what matters.
Automate user-events and tech-product process analytics in a low-code way.
We, at Insightarc, do believe that product teams should grow their products, not collect and analyze data; data teams should save time for manual code-driven analytics by immediate behavior data on-demand; engineers should have ad-hoc process analytics tool to receive the instant root-cause finder of product performance. Make insights mining simple as a traditional excel analysis and boost your tech-product efficiency in a low-code manner.
Feel free to contact me personally for a demo or freemium platform access.